It’s no secret that manufacturing isn’t the economic force it once was in the United States. The U.S. Bureau of Labor Statistics says that 7.5 million manufacturing jobs have been lost since the peak in 1969. A variety of factors account for this, notably companies moving manufacturing to other countries where labor costs are significantly lower. That said, there are still some cities where manufacturing is a big part of the economy. SmartAsset analyzed data to identify and rank the best places to work in manufacturing.
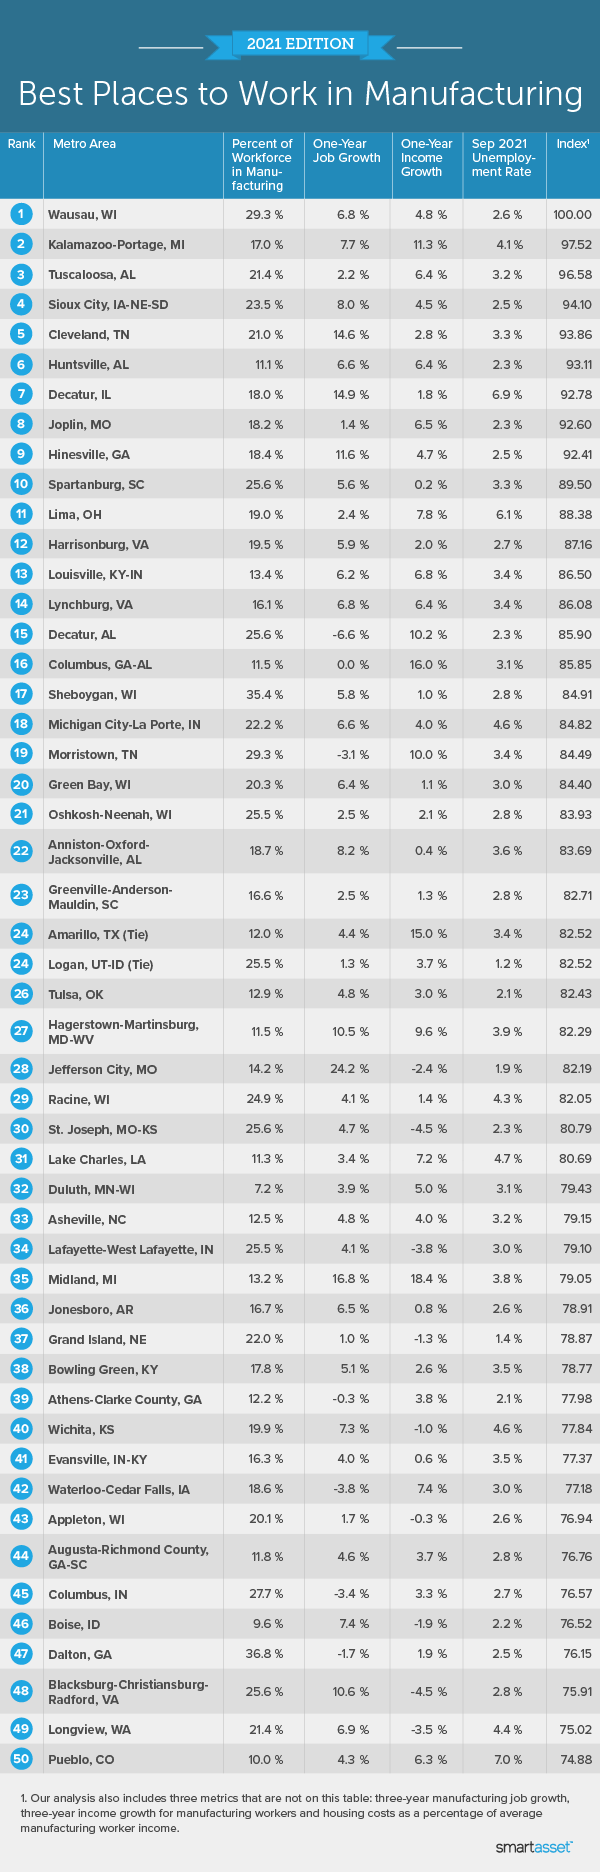
To do this, we analyzed nearly 400 metro areas across the following metrics: manufacturing as a percentage of the workforce, job growth from 2016 to 2019, job growth from 2018 to 2019, income growth from 2016 to 2019, income growth from 2018 to 2019, housing costs as a percentage of income and the September 2021 unemployment rate. For more details on how we found and analyzed our data, read the data and methodology section below.
This is SmartAsset’s sixth study on the best places to work in manufacturing. Read the 2020 version here.
Key Findings
- The geography is consistent. There are only two regions represented in the top 10 of this study: the South and the Midwest. Though many of the individual metro areas are different, these two historic manufacturing industry hubs dominated the top 10 in our study for the second year in a row.
- Manufacturing jobs are more robust in some areas than others. Across all of the metro areas analyzed, 11.46% of the workforce is in manufacturing. Elkhart-Goshen, Indiana has the biggest manufacturing workforce (55.28%). And comparatively, Laredo, Texas has the smallest (0.96%).
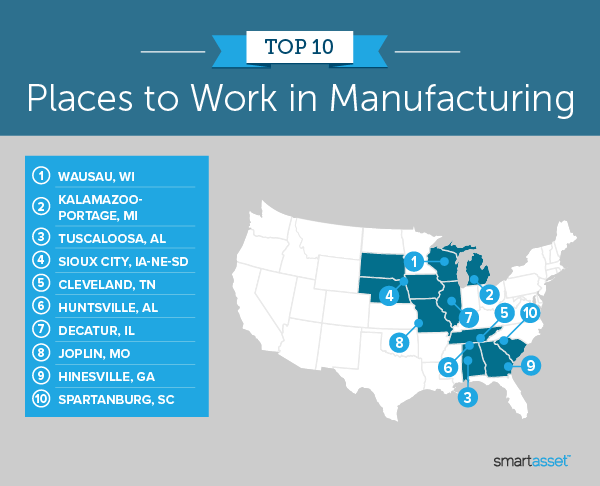
1. Wausau, WI
The best place to work in manufacturing for 2021 is Wausau, Wisconsin, where the industry makes up 29.34% of the workforce (the sixth-highest percentage). This metro area also finishes in the top quartile for two metrics measuring job growth: it saw 14.18% growth between 2016 and 2019 (49th) and 6.79% between 2018 and 2019 (53rd).
2. Kalamazoo-Portage, MI
The Kalamazoo-Portage metro area places 54th for three-year income growth (13.68%) and 10th for one-year income growth (11.31%). Manufacturing makes up 16.97% of the workforce, placing 76th in this survey.
3. Tuscaloosa, AL
Tuscaloosa is the highest ranked Southern metro area on this list, with 21.43% of the workforce employed in manufacturing (ranking 30th). Housing costs in the area make up just 15.36% of income, the 44th-lowest out of all the cities studied. One-year income growth is also in the top 50, ranking 46th at 6.42%
4. Sioux City, IA-NE-SD
Sioux City’s metro area is spread out in three different states and has the 21st-highest rate of manufacturing jobs with 23.45% of the workforce. This area also saw the 10th-highest job growth between 2016 and 2019, a leap of 27.82%. Three year income growth wasn’t nearly as good, though, finishing in the bottom half (225th) with only 5.15% growth.
5. Cleveland, TN
Manufacturing jobs make up 20.99% of the workforce in Cleveland, Tennessee, the 34th-highest percentage in this study. Comparatively, job growth over one year in manufacturing ranks 11th, jumping 14.6%. The unemployment rate for September 2021 stood at 3.3% in Cleveland, ranking 102nd.
6. Huntsville, AL
Manufacturing jobs in Huntsville, Alabama’s workforce make up only 11.08%, the lowest ranked metro area (163rd) in the top 10 of this study for that metric. Manufacturing jobs here, however, have seen a 20.97% high income growth between 2016 and 2019, ranking 11th in this study. Huntsville had the 30th-lowest unemployment rate in September 2020 out of the areas studied (2.3%).
7. Decatur, IL
Manufacturing jobs make up 17.98% of Decatur’s workforce, ranking 60th in this study. This area is also in the top 10 for two metrics measuring job growth: sixth for three-year growth (30.90%) and 10th for one-year growth (14.88%).
8. Joplin, MO
Manufacturing jobs in Joplin, Missouri make up 18.24% of the workforce, the 57th-highest in this study. Income growth for manufacturing jobs between 2016 and 2019 was 16.05% (30th in this study). Additionally, growth between 2018 and 2019 was 6.52% (ranking 45th).
9. Hinesville, GA
Manufacturing jobs in Hinesville, Georgia rank 54th in this study, making up 18.37% of the workforce. This area had the biggest job growth between 2016 and 2019, with a whopping 51.04%. That said, incomes for manufacturing jobs actually shrunk by 1.87% during that period, placing Hinesville near the bottom (351th place).
10. Spartanburg, SC
The final metro area in the top 10 is Spartanburg, where 25.6% of the workforce is employed in manufacturing (16th in this study). Spartanburg ranks 18th in three year job growth, jumping 22.81%. One-year income growth, however, was only 0.17%, ranking 252nd.
Data and Methodology
To find the best places to work in manufacturing, we compared 378 metropolitan areas across the following metrics:
- Manufacturing as a percentage of the workforce. This is the percentage of all workers employed by manufacturing firms. Data comes from the Census Bureau’s 2019 County Business Patterns Survey.
- Three-year job growth. This is the percentage change in the number of people employed by manufacturing firms from 2016 to 2019. Data comes from the Census Bureau’s 2015 County Business Patterns Survey and Census Bureau’s 2018 County Business Patterns Survey.
- One-year job growth. This is the percentage change in the number of people employed by manufacturing firms from 2018 to 2019. Data comes from the Census Bureau’s 2017 County Business Patterns Survey and Census Bureau’s 2018 County Business Patterns Survey.
- Three-year income growth. This is the percentage change in manufacturing workers’ average incomes from 2016 to 2019. Data comes from the Census Bureau’s 2015 County Business Patterns Survey and Census Bureau’s 2018 County Business Patterns Survey.
- One-year income growth. This is the percentage change in manufacturing workers’ average incomes from 2018 to 2019. Data comes from the Census Bureau’s 2017 County Business Patterns Survey and Census Bureau’s 2018 County Business Patterns Survey.
- Housing costs as a percentage of average income for manufacturing workers. Data on median housing costs comes from the Census Bureau’s 2020 1-year American Community Survey. Data on the average income for manufacturing workers comes from the Census Bureau’s 2017 County Business Patterns Survey.
- Unemployment rate. Numbers come from the Bureau of Labor Statistics and are for September 2021. This rate incorporates all professions, not just manufacturing-specific ones.
First, we ranked each metro area in each metric. From there, we found the average ranking for each metro area, giving an equal weight to all metrics except for manufacturing as a percentage of the workforce, which we double-weighted. We then ranked the areas based on this average ranking. The metro area with the best average ranking received an index score of 100 and the metro area with the worst average ranking received an index score of 0.
Financial Planning Tips
- Whether you work in manufacturing or not, a financial advisor can help you make the most of your pay. SmartAsset’s free tool matches you with up to three financial advisors in your area, and you can interview your advisor matches at no cost to decide which one is right for you. If you’re ready to find an advisor who can help you achieve your financial goals, get started now.
- One key to planning your finances is knowing exactly how much you’ll have to put in the bank each week. Use SmartAsset’s paycheck calculator to see what your take home pay will be, and then you can figure out how to make the most of it.
Questions about our study? Contact us at press@smartasset.com
Photo credit: ©iStock.com/alvarez